Introduction
In this article, we describe a framework to assess the popularity of GitHub softwares. We illustrate the application of this framework on a snapshot of GitHub, collected on May, 1st, 2015.
Measuring Popularity
We consider the top-24 programming languages with more repositories in GitHub, which are the languages classified as popular by the GitHub advanced search engine. The following figure shows the distribution of the number of stars in the top-1,000 repositories of such languages.

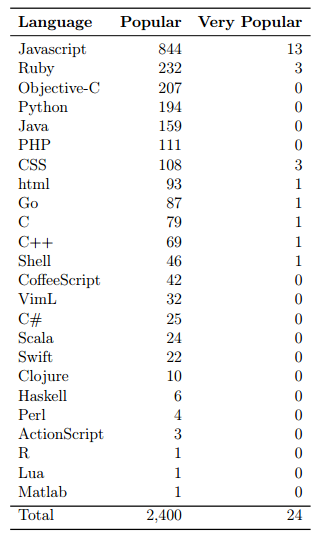
We consider popular the top-10% systems with more stars in our sample of 24,000 systems. Furthermore, we call very popular the top-1% systems with more stars.
This table shows the number of popular and very popular systems, per programming language.
Popularity Growth Patterns
For evaluating popularity over time, we restrict the analysis to popular systems with at least 52 weeks. In this way, we study 2,138 popular systems (89% of our initial sample). For a given system, we define that Rt is its rank in the list of popular systems in the week t in a logarithm scale (base 2). The ranks are considered in logarithm scale due to the right-skewed distribution in the number of stars of the the popular systems. The rank of the most popular system is 1. The earliest week is the week 1 (aka as Old) and the latest one is 52 (aka as New). We also define that RTop and RBottom are respectively the highest (best) and lowest rank (worse) of a system in the interval under analysis.
We propose the following patterns of popularity growth:
Sustainable Growth: These systems sustained their ranking in the period under analysis, i.e., the number of stars they received in an one-year interval was sufficient to preserve their position in the ranking of popular systems. We use the following relation to express a sustainable growth:
(RBottom − RTop ) < 0.25
Examples of systems with a sustainable growth:

Fast Growth: These are trending systems, which gained stars in a quantity that resulted in a relevant increase in their position in the ranking of popular systems, as captured by the following relation:
(ROld − RNow ) > 1 ∧ (Rt+1 ≤ Rt) in at least 90% of the weeks t
Examples of systems with a fast growth:

Slow Growth: These are systems receiving few stars on each week. As a result, they experienced a relevant decrease in their rank position, as represented by the following relation:
(RNow − ROld) > 1 ∧ (Rt+1 ≥ Rt) in at least 90% of the weeks t
Examples of systems with a slow growth in their number of stars (which resulted in a decrease on their rank):

Viral Growth: These systems experience a massive growth in their number of stars in a short period of time. Typically, viral growth results from word-of-mouth propagation in social networks. We consider that viral growth happens when a systems receives most of its stars (i.e., > 50%) in a single week.
Examples of systems with a viral growth:

This table shows the number of systems with a sustainable, fast, slow, and viral growth, per programming language:

Summing Up
We proposed a framework to track the popularity of GitHub systems. Using this framework we found that:
- JavaScript is responsible for more than one third of the popular applications on GitHub; the next five languages (Ruby, Objective-C, Python, Java, and PHP) are responsible for another third of the popular applications.
- 21% of the popular systems have a sustainable growth; 5% have a fast growth; and less than 1% have a slow growth. We also found 37 systems with a viral behavior.
More Info
Hudson Borges, Marco Tulio Valente, Andre Hora, Jailton Coelho. On the Popularity of GitHub Applications: A Preliminary Note. arXiv:1507.00604